Market Outlook
September 20, 2016
Market Cues
Domestic Indices
Chg (%)
(Pts)
(Close)
Indian markets are likely to open on a negative note considering global cues.
BSE Sensex
0.1
35
28,635
Nifty
0.3
29
8,808
US markets closed slightly lower on Friday after giving up intraday gains. Investors
Mid Cap
0.6
82
13,132
were reluctant to build positions ahead of the FOMC meeting and the expected
Small Cap
0.5
66
12,831
interest rate hike. Steel stocks were major gainers, continuing the commodity stocks
rally which began in Europe.
Bankex
0.3
75
22,810
European markets rallied strongly as higher crude prices pushed oil stocks higher
Global Indices
Chg (%)
(Pts)
(Close)
during the session. Crude futures rallied 2% ahead of potential deal between OPEC
and non-OPEC oil producers to stabilize oil prices. Energy stocks Tullow Oil, BP Plc
Dow Jones
(0.0)
(4)
18,120
and Royal Dutch Shell climbed around 2 percent each. Mining stocks Anglo
Nasdaq
(0.2)
(10)
5,235
American, BHP Billiton, Glencore and Rio Tinto jumped around 3-4 percent,
FTSE
1.5
103
6,814
reversing Friday’s losses.
Nikkei
0.7
114
16,519
Indian markets closed higher for a fourth consecutive session on Monday with
Hang Seng
0.9
215
23,550
modest gains. Most sectoral indices closed higher at the end of the session, with the
Shanghai Com
0.8
23
3,026
metal index reversing its losses over the last session to close up 1.4%. Market
sentiment remains cautious ahead of a possible rate hike by the US Fed as well as
Advances / Declines
BSE
NSE
other crucial economic indicators.
Advances
1,496
856
News Analysis
Declines
1,270
755
Motherson Sumi plans acquisition and capex of `2,000cr
Unchanged
226
88
CCI approves JSW Energy’s purchase of 500 MW plant
Detailed analysis on Pg2
Volumes (` Cr)
Investor’s Ready Reckoner
BSE
3,616
Key Domestic & Global Indicators
NSE
19,226
Stock Watch: Latest investment recommendations on 150+ stocks
Refer Pg5 onwards
Net Inflows (` Cr)
Net
Mtd
Ytd
Top Picks
FII
541
1,740
42,409
CMP
Target
Upside
Company
Sector
Rating
MFs
145
(440)
9,669
(`)
(`)
(%)
Amara Raja Batteries Auto & Auto Ancillary
Buy
1,005
1,174
16.9
HCL Tech
IT
Buy
787
1,000
27.0
Top Gainers
Price (`)
Chg (%)
Bharat Electronics
Capital Goods
Accumulate
1,236
1,414
14.4
Il&Fstrans
107
12.6
Equitas Holdings
Financials
Buy
180
235
30.6
Raymond
522
9.5
Navkar Corporation Others
Buy
199
265
33.2
Gvkpil
7
6.8
More Top Picks on Pg3
Ibrealest
93
6.8
Key Upcoming Events
Mrf
43,073
6.4
Previous
Consensus
Date
Region
Event Description
Reading
Expectations
Sep 20 US
Housing Starts
1,211.00
1,190.00
Top Losers
Price (`)
Chg (%)
Sep 20 US
Building permits
1,144.00
1,164.00
Castrolind
422
(4.5)
Sep 21 US
Initial Jobless claims
260.00
261.00
Jublfood
1,005
(3.5)
Sep 22 US
FOMC rate decision
0.50
0.50
Rtnpower
9
(3.4)
Sep 22 Euro Zone
Euro-Zone Consumer Confidence
(8.50)
(8.20)
Mfsl
570
(3.3)
Sep 22 Germany
PMI Manufacturing
53.60
53.10
Sep 23 US
Existing home sales
5.39
5.45
Shriramcit
2,148
(2.9)
As on September 19, 2016
Sep 23 Germany
PMI Services
51.70
52.20
6.(
More Events on Pg4
Market Outlook
September 20, 2016
News Analysis
Motherson Sumi plans acquisition and capex of `2,000cr
Motherson Sumi successfully closed its QIP raising over `1,900cr. The total
amount raised is aorund `2,600cr along with preference issue to Sumitomo. The
company is seeing a lot of opportunities and plans to do an acquisition by
year-end. The company also has capex plans of about `2,000cr funded by
internal accruals.
The company has also given a revenue growth forecast of $18 billion by 2020. Of
this, 50-55 percent is planned to come from organic growth.
CCI approves JSW Energy’s purchase of 500 MW plant
The Competition Commission of India (CCI) approved JSW Energy's purchase of
the 500-mw Bina thermal power plant from Jaiprakash Power Ventures. Under the
deal, announced in July, JSW Energy will buy 100 per cent stake in the special
purpose vehicle (SPV) -- Bina Power Supply Ltd (BPSL) -- to which the 500 mw
power plant is to be transferred.
The plant, which has two units of 250 mw generation capacity each, is located at
Bina in Madhya Pradesh. In July, JSW Energy informed BSE that it had agreed to
acquire
500 mw (2X250 MW) thermal power plant located at Bina. The
consideration to be received from JSW is linked to a base enterprise value as on
September 1, 2015, of `2,700cr for sale of 100 per cent of BPSL, subject to
mutually agreed adjustments. JSW Energy is into power generation, trading and
transmission, among others. Jaiprakash Power Ventures is part of the diversified
Jaypee Group.
Economic and Political News
Centre to get majority stake in GST Network, a company created to manage
IT infrastructure for GST
Indian healthcare obtains $397 mn in funding deals for 2016 YTD
Cauvery supervisory orders the release of 3,000 cusecs of water per day to
Tamil Nadu
Finance ministry invites applications for post of chairman of SEBI
Corporate News
Jubilant FoodWorks CEO Ajay Kaul steps down
Spicejet to increase flights from Kolkata to domestic and international
destinations
Glenmark Pharma enters into agreement with Particle Sciences to develop
generic cancer drug
Market Outlook
September 20, 2016
Top Picks ★★★★★
Large Cap
Market Cap
CMP
Target
Upside
Company
Rationale
(` Cr)
(`)
(`)
(%)
To outpace battery industry growth due to better technological
Amara Raja Batteries
17,158
1,005
1,174
16.9
products leading to market share gains in both the
automotive OEM and replacement segments.
Uptick in defense capex by government when coupled with
Bharat Electronics
29,653
1,236
1,414
14.4
BELs strong market positioning, indicate that good times are
ahead for BEL.
The stock is trading at attractive valuations and is factoring all
HCL Tech
1,11,048
787
1,000
27.0
the bad news.
Back on the growth trend, expect a long term growth of 14%
Infosys
2,43,740
1,061
1,370
29.1
to be a US$20bn in FY2020.
Source: Company, Angel Research
Mid Cap
Market Cap
CMP
Target
Upside
Company
Rationale
(` Cr)
(`)
(`)
(%)
Among the top 4 players in the consumer durables segment.
Bajaj Electricals
2,683
266
306
15.3
Improved profitability backed by turn around in E&P
segment. Strong order book lends earnings visibility.
Favourable outlook for the AC industry to augur well for
Cooling products business which is out pacing the market
Blue Star
4,955
520
578
11.2
growth. EMPPAC division's profitability to improve once
operating environment turns around.
With a focus on the low and medium income (LMI) consumer
Dewan Housing Finance
8,286
284
325
14.5
segment, the company has increased its presence in tier-II &
III cities where the growth opportunity is immense.
Strong loan growth backed by diversified loan portfolio and
adequate CAR. ROE & ROA likely to remain decent as risk of
Equitas Holdings
6,033
180
235
30.6
dilution remains low. Attractive valuations considering
growth.
Expectations of above average monsoon augurs well for
Goodyear India
1,474
639
684
7.0
Goodyear India as it derives ~50% of its turnover from farm
tyre segment.
Economic recovery to have favourable impact on advertising
& circulation revenue growth. Further, the acquisition of a
Jagran Prakashan
6,157
188
225
19.4
radio business (Radio City) would also boost the company's
revenue growth.
Speedier execution and speedier sales, strong revenue
Mahindra Lifespace
1,845
450
522
16.1
visibilty in short-to-long run, attractive valuations
Massive capacity expansion along with rail advantage at ICD
Navkar Corporation
2,838
199
265
33.2
as well CFS augurs well for the company
Earnings boost on back of stable material prices and
Radico Khaitan
1,428
107
125
16.4
favourable pricing environment. Valuation discount to peers
provides additional comfort
Strong brands and distribution network would boost growth
Siyaram Silk Mills
1,141
1,217
1,469
20.7
going ahead. Stock currently trades at an inexpensive
valuation.
Market leadership in Hindi news genre and no. 2 viewership
ranking in English news genre, exit from the radio business,
TV Today Network
1,871
314
363
15.8
and anticipated growth in ad spends by corporates to benefit
the stock.
Source: Company, Angel Research
Market Outlook
September 20, 2016
Key Upcoming Events
Global economic events release calendar
Bloomberg Data
Date
Time
Country
Event Description
Unit
Period
Last Reported
Estimated
Sep 20, 2016
6:00 PM
US
Housing Starts
Thousands
Aug
1,211.00
1,190.00
6:00 PM
US
Building permits
Thousands
Aug
1,144.00
1,164.00
Sep 21, 2016
6:00 PM
US
Initial Jobless claims
Thousands
Sep 17
260.00
261.00
Sep 22, 2016
11:30 PM
US
FOMC rate decision
%
Sep 21
0.50
0.50
7:30 PM Euro Zone Euro-Zone Consumer Confidence
Value Sep A
(8.50)
(8.20)
1:00 PM
Germany
PMI Manufacturing
Value Sep P
53.60
53.10
Sep 23, 2016
7:30 PM
US
Existing home sales
Million
Aug
5.39
5.45
1:00 PM
Germany
PMI Services
Value Sep P
51.70
52.20
Sep 26, 2016
7:30 PM
US
New home sales
Thousands
Aug
654.00
580.00
Sep 27, 2016
7:30 PM
US
Consumer ConfidenceS.A./ 1985=100
Sep
101.10
98.50
Sep 29, 2016
1:25 PM
Germany Unemployment change (000's)
Thousands
Sep
(7.00)
6:00 PM
US
GDP Qoq (Annualised)
% Change 2Q T
1.10
1.60
Sep 30, 2016
2:00 PM
UK
GDP (YoY)
% Change 2Q F
2.20
Oct 01, 2016
6:30 AM
China
PMI Manufacturing
Value
Sep
50.40
Oct 03, 2016
2:00 PM
UK
PMI Manufacturing
Value
Sep
53.30
Oct 04, 2016 11:00 AM
India
RBI Reverse Repo rate
% Oct 4
6.00
11:00 AM
India
RBI Repo rate
% Oct 4
6.50
2:00 PM
UK
Industrial Production (YoY)
% Change
Aug
2.10
Oct 07, 2016
11:00 AM
India
RBI Cash Reserve ratio
% Oct 4
4.00
6:00 PM
US
Change in Nonfarm payrolls
Thousands
Sep
151.00
173.00
6:00 PM
US
Unnemployment rate
% Sep
4.90
4.90
Source: Bloomberg, Angel Research
Market Outlook
September 20, 2016
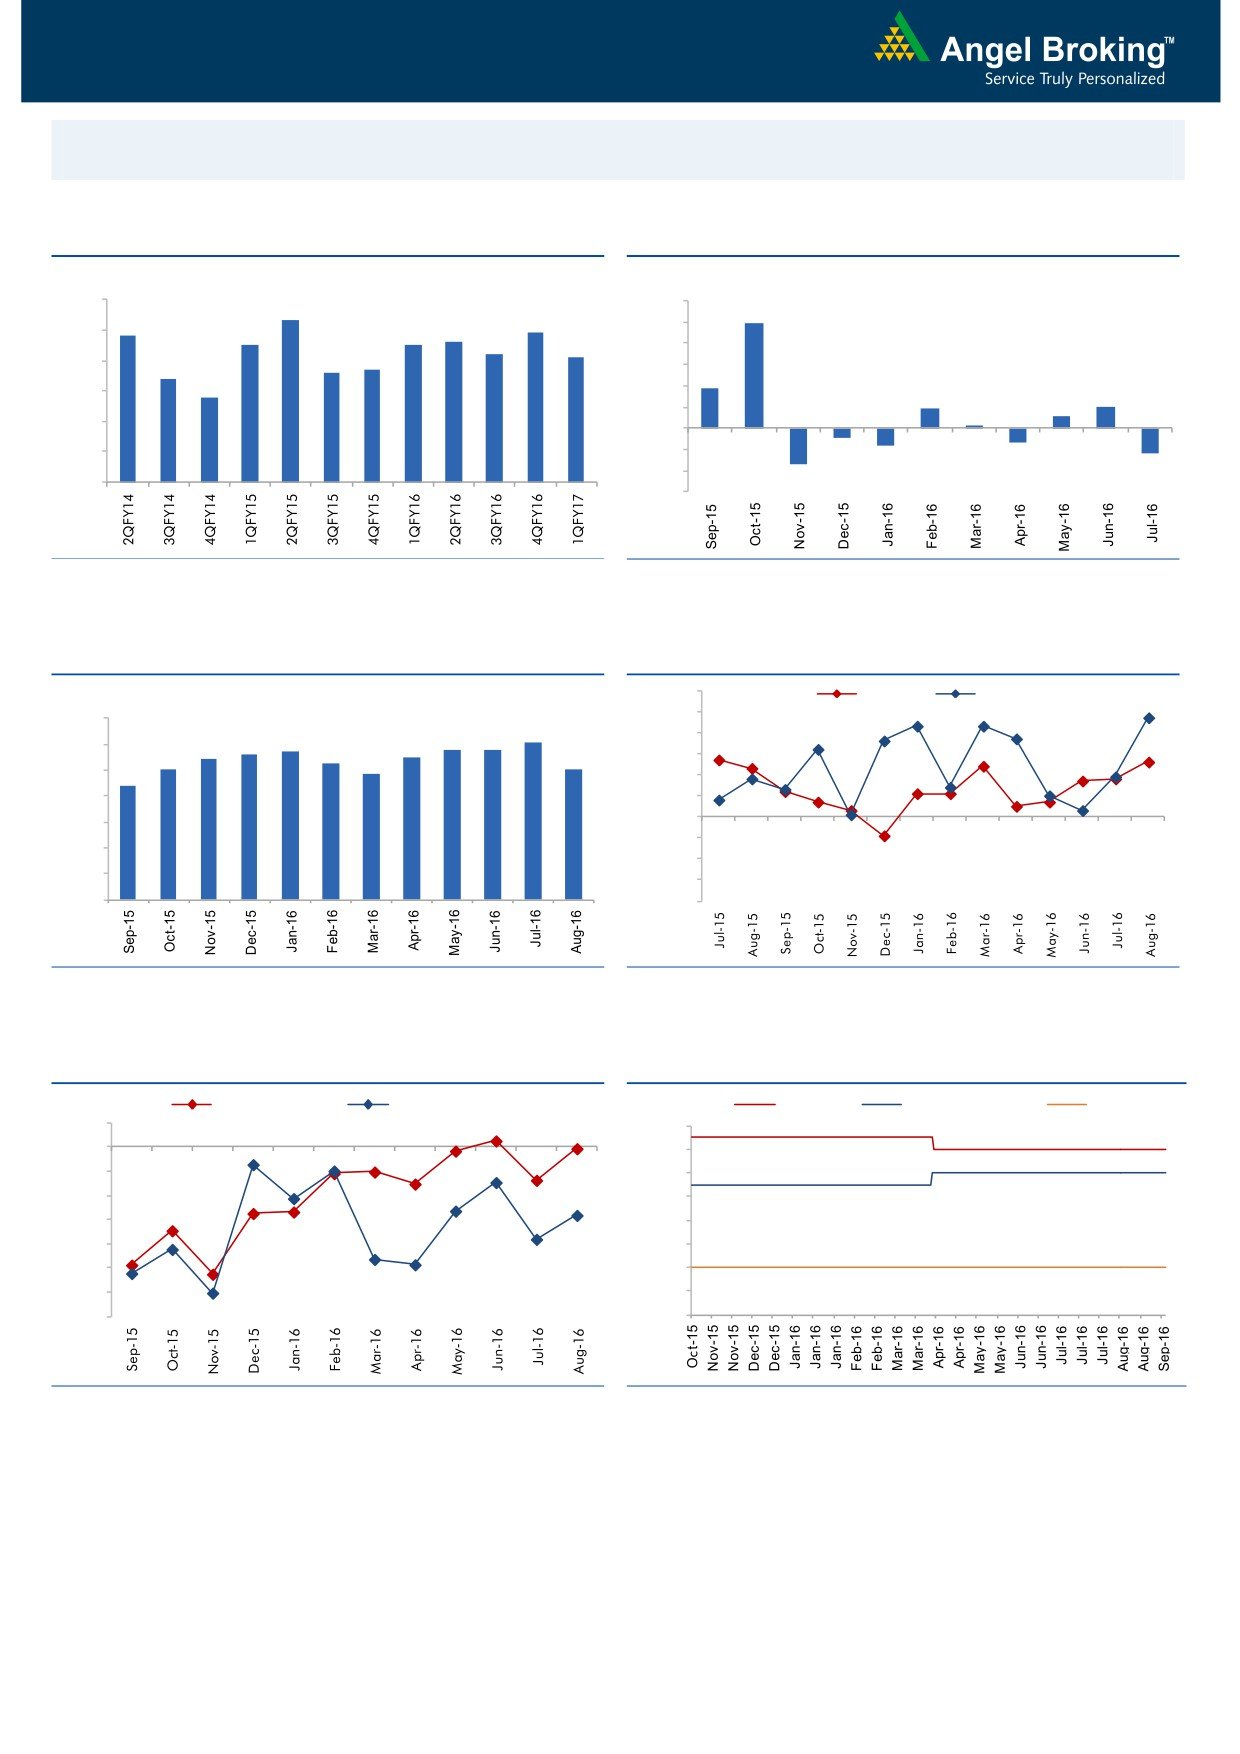
Macro watch
Exhibit 1: Quarterly GDP trends
Exhibit 2: IIP trends
(%)
(%)
9.0
12.0
8.3
9.9
7.8
7.9
8.0
7.5
7.5
7.6
10.0
7.2
7.1
8.0
6.6
6.7
7.0
6.4
6.0
3.7
5.8
6.0
4.0
1.9
2.0
1.1
2.0
0.3
5.0
-
4.0
(2.0)
(0.9)
(1.3)
(1.6)
(4.0)
(2.4)
3.0
(3.4)
(6.0)
Source: CSO, Angel Research
Source: MOSPI, Angel Research
Exhibit 3: Monthly CPI inflation trends
Exhibit 4: Manufacturing and services PMI
56.0
Mfg. PMI
Services PMI
(%)
55.0
7.0
6.1
5.7
5.8
5.8
54.0
6.0
5.4
5.6
5.5
5.0
5.3
5.1
53.0
4.8
5.0
4.4
52.0
4.0
51.0
50.0
3.0
49.0
2.0
48.0
1.0
47.0
-
46.0
Source: MOSPI, Angel Research
Source: Market, Angel Research; Note: Level above 50 indicates expansion
Exhibit 5: Exports and imports growth trends
Exhibit 6: Key policy rates
(%)
Exports yoy growth
Imports yoy growth
(%)
Repo rate
Reverse Repo rate
CRR
5.0
7.00
0.0
6.50
(5.0)
6.00
(10.0)
5.50
(15.0)
5.00
(20.0)
4.50
(25.0)
4.00
(30.0)
3.50
(35.0)
3.00
Source: Bloomberg, Angel Research
Source: RBI, Angel Research
Market Outlook
September 20, 2016
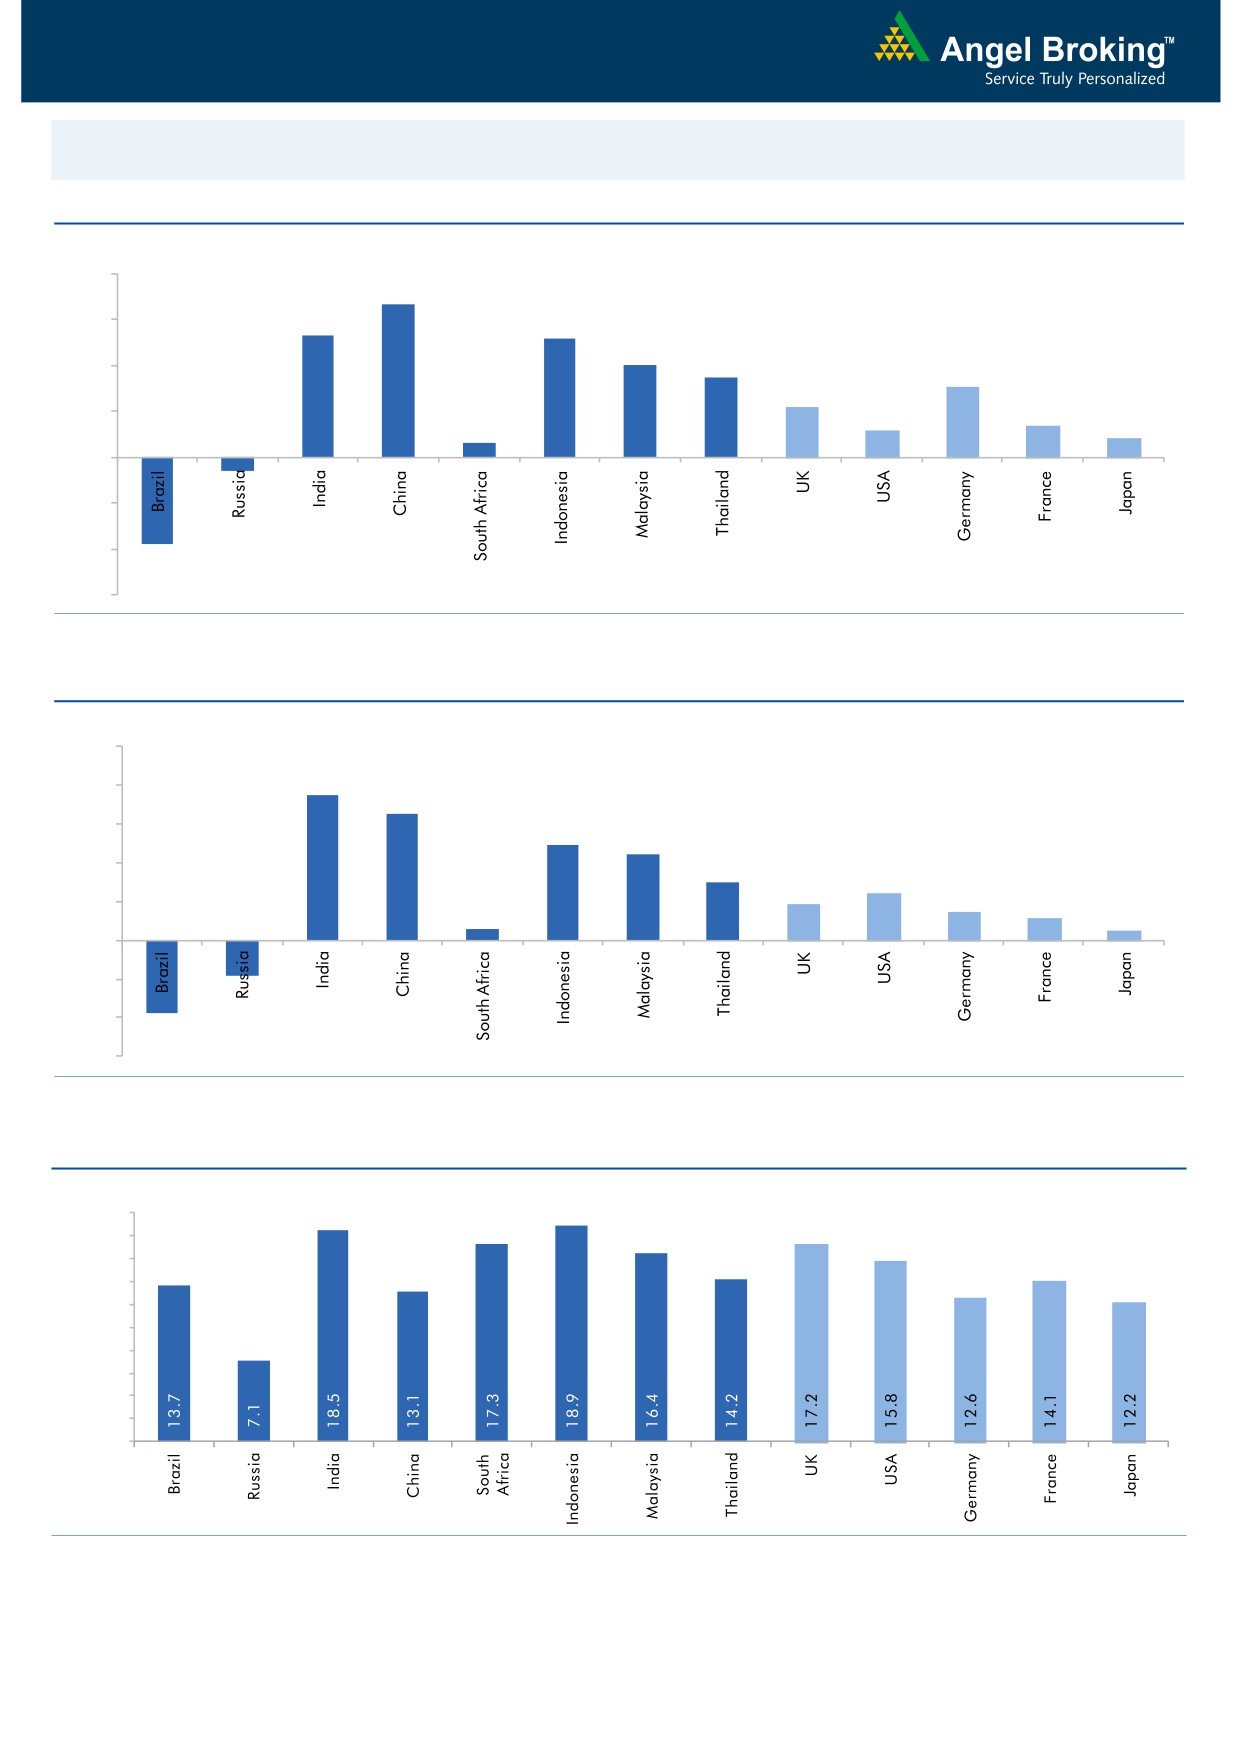
Global watch
Exhibit 1: Latest quarterly GDP Growth (%, yoy) across select developing and developed countries
(%)
8.0
6.7
6.0
5.3
0.6
5.2
4.0
3.5
4.0
3.1
2.2
1.4
2.0
1.2
0.8
-
(2.0)
(0.6)
(4.0)
(3.8)
(6.0)
Source: Bloomberg, Angel Research
Exhibit 2: 2016 GDP Growth projection by IMF (%, yoy) across select developing and developed countries
(%)
10.0
7.5
8.0
6.5
6.0
4.9
4.4
4.0
3.0
2.4
1.9
1.5
2.0
1.1
0.6
0.5
(3.8)
(1.8)
-
(2.0)
(4.0)
(6.0)
Source: IMF, Angel Research
Exhibit 3: One year forward P-E ratio across select developing and developed countries
(x)
20.0
18.0
16.0
14.0
12.0
10.0
8.0
6.0
4.0
2.0
-
Source: IMF, Angel Research
Market Outlook
September 20, 2016
Exhibit 4: Relative performance of indices across globe
Returns (%)
Country
Name of index
Closing price
1M
3M
1YR
Brazil
Bovespa
57,350
(3.0)
15.2
23.0
Russia
Micex
1,987
0.7
4.2
14.7
India
Nifty
8,808
1.9
7.3
14.6
China
Shanghai Composite
3,026
(2.7)
4.9
(6.7)
South Africa
Top 40
45,496
(1.3)
(1.4)
(0.3)
Mexico
Mexbol
45,871
(5.0)
1.4
5.4
Indonesia
LQ45
919
(0.4)
11.1
27.0
Malaysia
KLCI
1,652
(2.3)
1.3
4.1
Thailand
SET 50
952
(3.6)
4.4
6.0
USA
Dow Jones
18,120
(2.3)
2.2
10.6
UK
FTSE
6,814
(0.7)
9.8
14.8
Japan
Nikkei
16,519
(1.4)
7.0
(7.5)
Germany
DAX
10,374
(2.3)
3.4
7.7
France
CAC
4,394
(1.0)
0.6
0.8
Source: Bloomberg, Angel Research
Stock Watch
September 20, 2016
Company Name
Reco
CMP
Target
Mkt Cap
Sales ( Čcr )
OPM(%)
EPS (Č)
PER(x)
P/BV(x)
RoE(%)
EV/Sales(x)
(Č)
Price ( Č)
( Č cr )
FY17E FY18E
FY17E
FY18E
FY17E
FY18E
FY17E
FY18E
FY17E
FY18E
FY17E
FY18E
FY17E
FY18E
Agri / Agri Chemical
Rallis
Neutral
217
-
4,225
1,937
2,164
13.3
14.3
9.0
11.0
24.1
19.8
4.2
3.7
18.4
19.8
2.2
2.0
United Phosphorus
Accumulate
682
684
34,590
15,176
17,604
18.5
18.5
37.4
44.6
18.2
15.3
3.6
3.0
21.4
21.2
2.3
1.9
Auto & Auto Ancillary
Ashok Leyland
Buy
85
111
24,062
22,407
26,022
10.6
10.6
5.2
6.4
16.2
13.2
3.7
3.1
23.6
24.7
1.1
1.0
Bajaj Auto
Neutral
2,946
-
85,240
25,093
27,891
19.5
19.2
143.9
162.5
20.5
18.1
5.7
4.9
30.3
29.4
3.1
2.7
Bharat Forge
Neutral
903
-
21,027
7,726
8,713
20.5
21.2
35.3
42.7
25.6
21.2
4.7
4.3
18.9
20.1
2.6
2.3
Eicher Motors
Neutral
23,129
-
62,822
16,583
20,447
17.5
18.0
598.0
745.2
38.7
31.0
13.2
10.1
41.2
38.3
3.6
2.8
Gabriel India
Neutral
119
-
1,708
1,544
1,715
9.0
9.3
5.4
6.3
22.0
18.9
4.2
3.7
18.9
19.5
1.0
0.9
Hero Motocorp
Neutral
3,554
-
70,975
31,253
35,198
15.3
15.0
172.3
192.1
20.6
18.5
7.6
6.5
38.9
37.0
2.1
1.9
Jamna Auto Industries Neutral
225
-
1,800
1,486
1,620
9.8
9.9
15.0
17.2
15.0
13.1
3.3
2.8
21.8
21.3
1.2
1.1
L G Balakrishnan & Bros Neutral
574
-
902
1,302
1,432
11.6
11.9
43.7
53.0
13.2
10.8
1.9
1.7
13.8
14.2
0.7
0.7
Mahindra and Mahindra Neutral
1,416
-
87,956
46,534
53,077
11.6
11.7
67.3
78.1
21.0
18.1
3.4
3.0
15.4
15.8
1.9
1.6
Maruti
Neutral
5,484
-
165,649
69,186
82,217
14.7
14.4
198.5
241.4
27.6
22.7
5.4
4.4
20.2
20.0
2.0
1.6
Minda Industries
Neutral
303
-
2,406
2,728
3,042
9.0
9.1
68.2
86.2
4.5
3.5
1.0
0.8
23.8
24.3
0.9
0.8
Motherson Sumi
Neutral
320
-
42,374
45,896
53,687
7.8
8.3
13.0
16.1
24.6
19.9
7.9
6.3
34.7
35.4
1.0
0.8
Rane Brake Lining
Neutral
1,264
-
1,001
511
562
11.3
11.5
28.1
30.9
45.0
40.9
6.9
6.2
15.3
15.0
2.0
1.9
Setco Automotive
Neutral
44
-
588
741
837
13.0
13.0
15.2
17.0
2.9
2.6
0.5
0.4
15.8
16.3
1.2
1.1
Tata Motors
Neutral
554
-
159,807
300,209
338,549
8.9
8.4
42.7
54.3
13.0
10.2
2.1
1.8
15.6
17.2
0.6
0.6
TVS Motor
Neutral
337
-
16,013
13,390
15,948
6.9
7.1
12.8
16.5
26.4
20.4
6.6
5.2
26.3
27.2
1.2
1.0
Amara Raja Batteries
Buy
1,005
1,174
17,158
5,429
6,471
17.5
17.6
35.3
43.5
28.5
23.1
6.5
5.3
25.3
24.8
3.0
2.4
Exide Industries
Neutral
194
-
16,494
7,439
8,307
15.0
15.0
8.1
9.3
24.0
20.9
3.4
3.0
14.3
16.7
1.7
1.5
Apollo Tyres
Neutral
221
-
11,262
12,877
14,504
14.3
13.9
21.4
23.0
10.3
9.6
1.6
1.4
16.4
15.2
1.0
0.9
Ceat
Accumulate
1,128
1,119
4,564
7,524
8,624
13.0
12.7
131.1
144.3
8.6
7.8
1.6
1.3
19.8
18.6
0.6
0.5
JK Tyres
Neutral
150
-
3,398
7,455
8,056
15.0
15.0
21.8
24.5
6.9
6.1
1.4
1.2
22.8
21.3
0.5
0.5
Swaraj Engines
Neutral
1,220
-
1,515
660
810
15.2
16.4
54.5
72.8
22.4
16.8
7.0
6.3
31.5
39.2
2.1
1.7
Subros
Neutral
137
-
821
1,488
1,681
11.7
11.9
6.4
7.2
21.4
19.1
2.3
2.1
10.8
11.4
0.8
0.7
Indag Rubber
Neutral
176
-
463
286
326
19.8
16.8
11.7
13.3
15.1
13.2
2.6
2.4
17.8
17.1
1.3
1.1
Capital Goods
ACE
Neutral
43
-
430
709
814
4.1
4.6
1.4
2.1
31.0
20.7
1.3
1.2
4.4
6.0
0.8
0.7
BEML
Accumulate
910
1,157
3,791
3,451
4,055
6.3
9.2
31.4
57.9
29.0
15.7
1.7
1.6
6.3
10.9
1.4
1.2
Bharat Electronics
Buy
1,236
1,414
29,653
8,137
9,169
16.8
17.2
58.7
62.5
21.1
19.8
3.3
2.9
44.6
46.3
2.5
2.3
Stock Watch
September 20, 2016
Company Name
Reco
CMP
Target
Mkt Cap
Sales ( Čcr )
OPM(%)
EPS (Č)
PER(x)
P/BV(x)
RoE(%)
EV/Sales(x)
(Č)
Price ( Č)
( Č cr )
FY17E
FY18E
FY17E
FY18E
FY17E
FY18E
FY17E
FY18E
FY17E
FY18E
FY17E
FY18E
FY17E
FY18E
Capital Goods
Voltas
Accumulate
391
407
12,936
6,511
7,514
7.9
8.7
12.9
16.3
30.3
24.0
5.5
4.8
16.7
18.5
1.7
1.4
BGR Energy
Neutral
116
-
835
16,567
33,848
6.0
5.6
7.8
5.9
14.8
19.6
0.9
0.8
4.7
4.2
0.2
0.1
BHEL
Neutral
147
-
36,041
28,797
34,742
-
2.8
2.3
6.9
64.0
21.3
1.1
1.1
1.3
4.8
0.9
0.6
Blue Star
Accumulate
520
578
4,955
4,351
5,024
6.4
7.1
17.2
20.6
30.3
25.2
19.7
16.4
23.1
24.1
1.2
1.0
Crompton Greaves
Neutral
82
-
5,149
5,777
6,120
5.9
7.0
3.3
4.5
24.9
18.3
1.1
1.0
4.4
5.9
0.8
0.7
Greaves Cotton
Neutral
133
-
3,247
1,755
1,881
16.8
16.9
7.8
8.5
17.0
15.6
3.4
3.2
20.6
20.9
1.6
1.4
Inox Wind
Buy
199
286
4,410
5,605
6,267
15.7
16.4
24.8
30.0
8.0
6.6
2.2
1.6
25.9
24.4
0.7
0.6
KEC International
Neutral
120
-
3,081
9,294
10,186
7.9
8.1
9.9
11.9
12.1
10.1
1.8
1.5
15.6
16.3
0.6
0.5
Thermax
Neutral
893
-
10,635
5,421
5,940
7.3
7.3
25.7
30.2
34.7
29.6
4.2
3.8
12.2
13.1
1.7
1.6
VATech Wabag
Buy
552
681
3,010
3,136
3,845
8.9
9.1
26.0
35.9
21.2
15.4
2.7
2.3
13.4
15.9
0.9
0.7
Cement
ACC
Neutral
1,648
-
30,951
11,225
13,172
13.2
16.9
44.5
75.5
37.0
21.8
3.5
3.2
11.2
14.2
2.7
2.3
Ambuja Cements
Neutral
267
-
52,937
9,350
10,979
18.2
22.5
5.8
9.5
46.0
28.1
3.9
3.5
10.2
12.5
5.5
4.7
India Cements
Neutral
152
-
4,669
4,364
4,997
18.5
19.2
7.9
11.3
19.2
13.5
1.4
1.4
8.0
8.5
1.8
1.5
JK Cement
Neutral
796
-
5,568
4,398
5,173
15.5
17.5
31.2
55.5
25.5
14.4
3.1
2.7
12.0
15.5
1.8
1.5
J K Lakshmi Cement
Neutral
467
-
5,491
2,913
3,412
14.5
19.5
7.5
22.5
62.2
20.7
3.8
3.2
12.5
18.0
2.4
2.0
Orient Cement
Neutral
201
-
4,120
2,114
2,558
18.5
20.5
8.1
11.3
24.8
17.8
3.7
3.1
9.0
14.0
2.5
2.0
UltraTech Cement
Neutral
3,990
-
109,503
25,768
30,385
21.0
23.5
111.0
160.0
36.0
24.9
4.6
4.0
13.5
15.8
4.2
3.5
Construction
ITNL
Neutral
107
-
3,510
8,946
10,017
31.0
31.6
8.1
9.1
13.2
11.7
0.5
0.5
4.2
5.0
3.7
3.4
KNR Constructions
Buy
700
802
1,969
1,385
1,673
14.7
14.0
41.2
48.5
17.0
14.4
3.2
2.7
14.9
15.2
1.5
1.2
Larsen & Toubro
Buy
1,480
1,700
137,956
67,665
77,249
10.7
11.5
57.3
71.2
25.8
20.8
2.4
2.2
12.6
14.3
2.2
1.9
Gujarat Pipavav Port
Neutral
178
-
8,583
705
788
52.2
51.7
5.0
5.6
35.5
31.7
3.5
3.1
11.2
11.2
12.9
11.0
Nagarjuna Const.
Neutral
88
-
4,887
8,842
9,775
9.1
8.8
5.3
6.4
16.6
13.7
1.3
1.2
8.2
9.1
0.7
0.6
PNC Infratech
Buy
123
143
3,152
2,350
2,904
13.1
13.2
9.0
8.8
13.7
14.0
0.5
0.4
15.9
13.9
1.5
1.2
Simplex Infra
Neutral
327
-
1,619
6,829
7,954
10.5
10.5
31.4
37.4
10.4
8.8
1.1
1.0
9.9
13.4
0.7
0.6
Power Mech Projects
Neutral
480
-
706
1,801
2,219
12.7
14.6
72.1
113.9
6.7
4.2
1.2
1.0
16.8
11.9
0.4
0.3
Sadbhav Engineering
Neutral
297
-
5,090
3,598
4,140
10.3
10.6
9.0
11.9
33.0
24.9
3.5
3.0
9.9
11.9
1.7
1.4
NBCC
Neutral
252
-
15,120
7,428
9,549
7.9
8.6
8.2
11.0
30.7
22.9
1.5
1.2
28.2
28.7
1.7
1.3
MEP Infra
Neutral
43
-
703
1,877
1,943
30.6
29.8
3.0
4.2
14.4
10.3
7.0
4.7
0.6
0.6
1.8
1.6
SIPL
Neutral
106
-
3,734
1,036
1,252
65.5
66.2
(8.4)
(5.6)
4.0
4.5
(22.8)
(15.9)
11.7
9.8
Stock Watch
September 20, 2016
Company Name
Reco
CMP
Target
Mkt Cap
Sales ( Čcr )
OPM(%)
EPS (Č)
PER(x)
P/BV(x)
RoE(%)
EV/Sales(x)
(Č)
Price ( Č)
( Č cr )
FY17E
FY18E
FY17E
FY18E
FY17E
FY18E
FY17E
FY18E
FY17E
FY18E
FY17E
FY18E
FY17E
FY18E
Construction
Engineers India
Neutral
265
-
8,937
1,725
1,935
16.0
19.1
11.4
13.9
23.3
19.1
3.2
3.1
13.4
15.3
3.9
3.5
Financials
Axis Bank
Neutral
594
-
141,881
58,081
66,459
3.5
3.5
32.4
44.6
18.4
13.3
2.4
2.1
13.6
16.5
-
-
Bank of Baroda
Neutral
166
-
38,341
19,980
23,178
1.8
1.8
11.5
17.3
14.5
9.6
1.7
1.4
8.3
10.1
-
-
Canara Bank
Neutral
303
-
16,436
15,225
16,836
1.8
1.8
14.5
28.0
20.9
10.8
1.4
1.2
5.8
8.5
-
-
Dewan Housing Finance Buy
284
325
8,286
2,225
2,688
2.9
2.9
29.7
34.6
9.6
8.2
1.5
1.3
16.1
16.8
-
-
Equitas Holdings
Buy
180
235
6,033
939
1,281
11.7
11.5
5.8
8.2
31.0
21.9
2.7
2.4
10.9
11.5
-
-
Federal Bank
Neutral
74
-
12,706
9,353
10,623
2.9
2.9
4.4
5.8
16.8
12.8
1.6
1.4
9.5
11.0
-
-
HDFC
Neutral
1,394
-
220,402
11,475
13,450
3.4
3.4
45.3
52.5
30.8
26.6
5.9
5.2
20.2
20.5
-
-
HDFC Bank
Accumulate
1,290
1,350
326,595
46,097
55,433
4.5
4.5
58.4
68.0
22.1
19.0
3.9
3.2
18.8
18.6
-
-
ICICI Bank
Neutral
272
-
158,133
39,029
45,903
3.3
3.3
16.7
16.3
16.3
16.7
2.0
1.8
10.1
12.4
-
-
LIC Housing Finance
Neutral
574
-
28,942
3,712
4,293
2.6
2.5
39.0
46.0
14.7
12.5
2.8
2.4
19.9
20.1
-
-
Punjab Natl.Bank
Neutral
138
-
27,157
23,532
23,595
2.3
2.4
6.8
12.6
20.3
11.0
3.1
2.2
3.3
6.5
-
-
RBL Bank
Accumulate
301
325
11,144
1,783
2,309
2.6
2.6
12.7
16.4
23.7
18.4
2.6
2.3
12.8
13.3
-
-
South Ind.Bank
Neutral
24
-
3,180
6,435
7,578
2.5
2.5
2.7
3.1
8.7
7.6
1.1
0.9
10.1
11.2
-
-
St Bk of India
Neutral
256
-
198,455
88,650
98,335
2.6
2.6
13.5
18.8
18.9
13.6
1.8
1.6
7.0
8.5
-
-
Union Bank
Neutral
142
-
9,744
13,450
14,925
2.3
2.3
25.5
34.5
5.6
4.1
0.8
0.7
7.5
10.2
-
-
Yes Bank
Neutral
1,178
-
49,596
8,978
11,281
3.3
3.4
74.0
90.0
15.9
13.1
3.0
2.6
17.0
17.2
-
-
FMCG
Asian Paints
Neutral
1,163
-
111,598
17,128
18,978
16.8
16.4
19.1
20.7
60.9
56.2
21.2
20.0
34.8
35.5
6.4
5.8
Britannia
Neutral
3,412
-
40,932
9,795
11,040
14.6
14.9
80.3
94.0
42.5
36.3
17.5
13.5
41.2
-
4.1
3.5
Colgate
Neutral
968
-
26,331
4,605
5,149
23.4
23.4
23.8
26.9
40.7
36.0
22.5
17.6
64.8
66.8
5.7
5.1
Dabur India
Neutral
294
-
51,701
8,315
9,405
19.8
20.7
8.1
9.2
36.3
32.0
10.1
8.4
31.6
31.0
5.8
5.1
GlaxoSmith Con*
Neutral
6,183
-
26,001
4,350
4,823
21.2
21.4
179.2
196.5
34.5
31.5
9.2
7.8
27.1
26.8
5.3
4.7
Godrej Consumer
Neutral
1,657
-
56,428
10,235
11,428
18.4
18.6
41.1
44.2
40.3
37.5
8.9
7.6
24.9
24.8
5.4
4.8
HUL
Neutral
913
-
197,487
35,252
38,495
17.6
17.4
20.4
21.9
44.7
41.7
36.7
32.2
82.2
77.3
5.5
5.0
ITC
Accumulate
258
283
311,608
40,059
44,439
39.0
39.2
9.1
10.1
28.4
25.6
7.7
6.8
27.2
26.5
7.1
6.4
Marico
Neutral
294
-
37,925
6,430
7,349
18.8
19.5
6.4
7.7
45.9
38.2
13.9
11.7
33.2
32.5
5.6
4.8
Nestle*
Neutral
6,333
-
61,057
10,073
11,807
20.7
21.5
124.8
154.2
50.7
41.1
20.8
18.7
34.8
36.7
6.0
5.1
Tata Global
Neutral
139
-
8,792
8,675
9,088
9.8
9.8
7.4
8.2
18.8
17.0
2.1
2.1
7.9
8.1
0.9
0.8
Procter & Gamble
Accumulate
6,749
7,369
21,908
2,939
3,342
23.2
23.0
146.2
163.7
46.2
41.2
103.4
99.1
25.3
23.5
6.9
6.0
Hygiene
Stock Watch
September 20, 2016
Company Name
Reco
CMP
Target
Mkt Cap
Sales ( Čcr )
OPM(%)
EPS (Č)
PER(x)
P/BV(x)
RoE(%)
EV/Sales(x)
(Č)
Price ( Č)
( Č cr )
FY17E FY18E
FY17E
FY18E
FY17E
FY18E
FY17E
FY18E
FY17E
FY18E
FY17E
FY18E
FY17E
FY18E
IT
HCL Tech^
Buy
787
1,000
111,048
49,242
57,168
20.5
20.5
55.7
64.1
14.1
12.3
2.9
2.2
20.3
17.9
2.1
1.7
Infosys
Buy
1,061
1,370
243,740
69,934
79,025
27.5
27.5
64.8
72.0
16.4
14.7
3.6
3.3
22.0
22.3
2.9
2.5
TCS
Buy
2,407
3,004
474,351
121,684
136,286
27.3
27.3
135.0
150.1
17.8
16.0
5.9
5.5
33.2
33.9
3.6
3.1
Tech Mahindra
Buy
466
700
45,201
30,347
33,685
17.0
17.0
37.5
41.3
12.4
11.3
2.7
2.3
21.8
20.7
1.2
1.0
Wipro
Buy
480
680
116,772
51,631
55,822
21.7
17.9
35.9
36.9
13.4
13.0
2.8
2.6
19.0
18.1
2.0
1.7
Media
D B Corp
Neutral
400
-
7,358
2,297
2,590
27.4
28.2
21.0
23.4
19.1
17.1
4.5
3.9
23.7
23.1
3.0
2.6
HT Media
Neutral
82
-
1,916
2,693
2,991
12.6
12.9
7.9
9.0
10.4
9.1
0.9
0.8
7.8
8.3
0.3
0.2
Jagran Prakashan
Buy
188
225
6,157
2,355
2,635
28.0
28.0
10.8
12.5
17.4
15.1
3.8
3.3
21.7
21.7
2.6
2.3
Sun TV Network
Neutral
490
-
19,328
2,850
3,265
70.1
71.0
26.2
30.4
18.7
16.1
4.8
4.2
24.3
25.6
5.8
5.0
Hindustan Media
Neutral
286
-
2,099
1,016
1,138
24.3
25.2
27.3
30.1
10.5
9.5
2.0
1.8
16.2
15.8
1.4
1.2
Ventures
TV Today Network
Buy
314
363
1,871
637
743
27.5
27.5
18.4
21.4
17.1
14.7
3.0
2.5
17.4
17.2
2.4
2.0
Metals & Mining
Coal India
Neutral
329
-
207,682
84,638
94,297
21.4
22.3
24.5
27.1
13.4
12.1
5.6
5.3
42.6
46.0
2.0
1.8
Hind. Zinc
Neutral
217
-
91,732
14,252
18,465
55.9
48.3
15.8
21.5
13.7
10.1
2.2
2.0
17.0
20.7
6.3
4.9
Hindalco
Neutral
144
-
29,736
107,899
112,095
7.4
8.2
9.2
13.0
15.7
11.1
0.8
0.7
4.8
6.6
0.8
0.7
JSW Steel
Neutral
1,769
-
42,764
53,201
58,779
16.1
16.2
130.6
153.7
13.6
11.5
1.8
1.6
14.0
14.4
1.6
1.3
NMDC
Neutral
103
-
40,975
6,643
7,284
44.4
47.7
7.1
7.7
14.6
13.4
1.3
1.2
8.8
9.2
4.0
3.6
SAIL
Neutral
47
-
19,473
47,528
53,738
(0.7)
2.1
(1.9)
2.6
18.1
0.5
0.5
(1.6)
3.9
1.3
1.2
Vedanta
Neutral
165
-
48,829
71,744
81,944
19.2
21.7
13.4
20.1
12.3
8.2
1.1
0.9
8.4
11.3
1.1
0.8
Tata Steel
Neutral
362
-
35,114
121,374
121,856
7.2
8.4
18.6
34.3
19.4
10.5
1.2
1.1
6.1
10.1
0.9
0.9
Oil & Gas
Cairn India
Neutral
192
-
36,035
9,127
10,632
4.3
20.6
8.8
11.7
21.8
16.4
0.7
0.7
3.3
4.2
5.3
4.4
GAIL
Neutral
389
-
49,293
56,220
65,198
9.3
10.1
27.1
33.3
14.3
11.7
1.3
1.2
9.3
10.7
1.1
0.9
ONGC
Neutral
254
-
217,309
137,222
152,563
15.0
21.8
19.5
24.1
13.0
10.5
1.1
1.1
8.5
10.1
1.8
1.6
Indian Oil Corp
Neutral
571
-
138,673
373,359
428,656
5.9
5.5
54.0
59.3
10.6
9.6
1.6
1.5
16.0
15.6
0.5
0.4
Reliance Industries
Neutral
1,082
-
350,946
301,963
358,039
12.1
12.6
87.7
101.7
12.3
10.6
1.3
1.2
10.7
11.3
1.6
1.3
Pharmaceuticals
Alembic Pharma
Neutral
646
-
12,182
3,483
4,083
20.2
21.4
24.3
30.4
26.6
21.3
6.1
4.8
25.5
25.3
3.3
2.8
Aurobindo Pharma
Accumulate
805
877
47,083
15,720
18,078
23.7
23.7
41.4
47.3
19.4
17.0
5.1
4.0
29.6
26.1
3.1
2.7
Aventis*
Neutral
4,291
-
9,883
2,357
2,692
17.3
17.3
153.5
169.2
28.0
25.4
4.7
3.8
25.8
28.4
3.9
3.2
Cadila Healthcare
Neutral
387
-
39,629
11,126
13,148
22.0
22.0
17.1
20.0
22.6
19.4
5.8
4.6
28.8
26.6
3.5
2.9
Cipla
Reduce
598
490
48,029
15,378
18,089
17.4
18.4
21.6
27.2
27.7
22.0
3.6
3.1
13.7
15.2
3.2
2.6
Stock Watch
September 20, 2016
Company Name
Reco
CMP
Target
Mkt Cap
Sales ( Čcr )
OPM(%)
EPS (Č)
PER(x)
P/BV(x)
RoE(%)
EV/Sales(x)
(Č)
Price ( Č)
( Č cr )
FY17E FY18E
FY17E
FY18E
FY17E
FY18E
FY17E
FY18E
FY17E
FY18E
FY17E
FY18E
FY17E
FY18E
Pharmaceuticals
Dr Reddy's
Neutral
3,157
-
52,304
16,043
18,119
23.1
24.7
126.0
157.8
25.1
20.0
3.7
3.2
15.7
17.1
3.2
2.8
Dishman Pharma
Sell
197
45
3,179
1,718
1,890
22.7
22.8
9.5
11.3
20.7
17.4
2.0
1.8
10.1
10.9
2.1
1.8
GSK Pharma*
Neutral
2,840
-
24,057
3,528
3,811
16.6
18.8
51.8
59.4
54.8
47.8
14.7
14.6
26.3
30.6
6.9
6.5
Indoco Remedies
Sell
323
225
2,976
1,112
1,289
18.2
18.2
13.2
15.6
24.5
20.7
4.4
3.7
19.2
19.2
2.7
2.3
Ipca labs
Accumulate
592
613
7,464
3,303
3,799
15.3
15.3
17.3
19.7
34.2
30.0
3.0
2.7
9.1
9.4
2.3
2.0
Lupin
Buy
1,543
1,809
69,556
15,912
18,644
26.4
26.7
58.1
69.3
26.6
22.3
5.2
4.2
21.4
20.9
4.4
3.6
Sun Pharma
Buy
783
944
188,504
31,129
35,258
30.0
30.9
28.0
32.8
28.0
23.9
4.3
3.6
18.7
18.9
5.7
4.8
Power
Tata Power
Neutral
77
-
20,785
36,916
39,557
17.4
27.1
5.1
6.3
15.1
12.2
1.3
1.2
9.0
10.3
1.6
1.4
NTPC
Neutral
155
-
128,093
86,605
95,545
17.5
20.8
11.8
13.4
13.2
11.6
1.3
1.3
10.5
11.1
2.8
2.8
Power Grid
Neutral
177
-
92,730
25,763
29,762
74.3
73.1
14.8
17.3
12.0
10.3
1.9
1.6
16.9
17.5
7.9
7.5
Real Estate
Prestige Estate
Neutral
197
-
7,380
4,707
5,105
25.2
26.0
10.3
13.0
19.1
15.1
1.5
1.4
10.3
10.2
2.8
2.5
MLIFE
Buy
450
522
1,845
1,152
1,300
22.7
24.6
29.9
35.8
15.0
12.6
1.1
1.1
7.6
8.6
2.2
1.9
Telecom
Bharti Airtel
Neutral
324
-
129,536
105,086
114,808
34.5
34.7
12.2
16.4
26.6
19.8
1.8
1.7
6.8
8.4
2.1
1.8
Idea Cellular
Neutral
85
-
30,517
40,133
43,731
37.2
37.1
6.4
6.5
13.2
13.0
1.1
1.0
8.2
7.6
1.8
1.5
zOthers
Abbott India
Neutral
4,679
-
9,942
3,153
3,583
14.1
14.4
152.2
182.7
30.7
25.6
150.9
128.9
25.6
26.1
2.8
2.4
Bajaj Electricals
Accumulate
266
306
2,683
5,099
5,805
5.6
5.9
11.4
14.6
23.4
18.2
3.1
2.8
13.4
15.1
0.5
0.5
Finolex Cables
Neutral
433
-
6,620
2,883
3,115
12.0
12.1
14.2
18.6
30.5
23.3
16.2
14.2
15.8
14.6
2.0
1.8
Goodyear India*
Buy
639
684
1,474
1,598
1,704
10.4
10.2
49.4
52.6
12.9
12.2
59.7
52.4
18.2
17.0
0.5
71.9
Hitachi
#N/A
1,457
3,962
Jyothy Laboratories
Neutral
335
-
6,069
1,440
2,052
11.5
13.0
8.5
10.0
39.4
33.5
9.6
8.8
18.6
19.3
4.3
3.0
Page Industries
Neutral
15,197
-
16,950
2,450
3,124
20.1
17.6
299.0
310.0
50.8
49.0
338.5
258.4
47.1
87.5
6.6
5.2
Relaxo Footwears
Neutral
418
-
5,019
2,085
2,469
9.2
8.2
7.6
8.0
55.3
52.6
21.4
18.3
17.9
18.8
2.6
2.2
Siyaram Silk Mills
Buy
1,217
1,469
1,141
1,799
2,040
11.6
11.7
104.9
122.4
11.6
9.9
1.9
1.6
16.4
16.4
0.8
0.7
Styrolution ABS India*
Neutral
601
-
1,057
1,440
1,537
9.2
9.0
40.6
42.6
14.8
14.1
37.8
34.4
12.3
11.6
0.6
0.6
TVS Srichakra
Accumulate
2,862
2,932
2,191
2,304
2,614
13.7
13.8
231.1
266.6
12.4
10.7
321.6
253.2
33.9
29.3
0.9
0.7
HSIL
Neutral
350
-
2,527
2,384
2,515
15.8
16.3
15.3
19.4
22.9
18.0
22.7
19.5
7.8
9.3
1.2
1.1
Kirloskar Engines India
Neutral
304
-
4,396
2,554
2,800
9.9
10.0
10.5
12.1
29.0
25.1
12.1
11.4
10.7
11.7
1.3
1.1
Ltd
M M Forgings
Neutral
418
-
504
546
608
20.4
20.7
41.3
48.7
10.1
8.6
57.2
50.6
16.6
17.0
0.8
0.7
Banco Products (India)
Neutral
220
-
1,576
1,353
1,471
12.3
12.4
14.5
16.3
15.2
13.5
21.0
18.9
14.5
14.6
1.1
115.5
Stock Watch
September 20, 2016
Company Name
Reco
CMP
Target
Mkt Cap
Sales ( Čcr )
OPM(%)
EPS (Č)
PER(x)
P/BV(x)
RoE(%)
EV/Sales(x)
(Č)
Price ( Č)
( Č cr )
FY17E
FY18E
FY17E
FY18E
FY17E
FY18E
FY17E
FY18E
FY17E
FY18E
FY17E
FY18E
FY17E
FY18E
zOthers
Competent Automobiles Neutral
202
-
124
1,137
1,256
3.1
2.7
28.0
23.6
7.2
8.6
38.9
35.2
14.3
11.5
0.1
0.1
Nilkamal
Neutral
1,348
-
2,011
1,995
2,165
10.7
10.4
69.8
80.6
19.3
16.7
77.0
66.9
16.6
16.5
1.0
0.9
Visaka Industries
Neutral
194
-
308
1,051
1,138
10.3
10.4
21.0
23.1
9.2
8.4
24.9
23.3
9.0
9.2
0.6
0.5
Transport Corporation of
Neutral
205
-
1,571
2,671
2,911
8.5
8.8
13.9
15.7
14.8
13.1
2.0
1.8
13.7
13.8
0.6
0.6
India
Elecon Engineering
Accumulate
61
63
666
1,482
1,660
13.7
14.5
3.9
5.8
15.7
10.5
3.7
3.4
7.8
10.9
0.7
0.7
Surya Roshni
Neutral
203
-
889
3,342
3,625
7.8
7.5
17.3
19.8
11.7
10.3
22.3
17.9
10.5
10.8
0.5
0.5
MT Educare
Neutral
137
-
545
366
417
17.7
18.2
9.4
10.8
14.6
12.7
3.2
2.8
22.2
22.3
1.3
1.1
Radico Khaitan
Buy
107
125
1,428
1,659
1,802
13.0
13.2
6.3
7.4
17.0
14.6
1.5
1.4
8.6
9.3
1.3
1.2
Garware Wall Ropes
Neutral
520
-
1,138
873
938
12.9
13.1
30.9
34.9
16.8
14.9
2.6
2.3
15.7
15.2
1.2
1.1
Wonderla Holidays
Neutral
386
-
2,178
287
355
38.0
40.0
11.3
14.2
34.1
27.2
4.9
4.3
21.4
23.9
7.6
6.1
Linc Pen & Plastics
Neutral
279
-
413
382
420
9.3
9.5
13.5
15.7
20.7
17.8
3.6
3.1
17.1
17.3
1.2
1.0
The Byke Hospitality
Neutral
161
-
644
287
384
20.5
20.5
7.6
10.7
21.1
15.0
4.4
3.6
20.7
23.5
2.2
1.7
Interglobe Aviation
Neutral
865
-
31,167
21,122
26,005
14.5
27.6
110.7
132.1
7.8
6.6
46.8
33.4
168.5
201.1
1.5
1.1
Coffee Day Enterprises
Neutral
234
-
4,825
2,964
3,260
20.5
21.2
4.7
8.0
-
29.3
2.7
2.5
5.5
8.5
2.0
1.8
Ltd
Navneet Education
Neutral
104
-
2,469
1,062
1,147
24.0
24.0
6.1
6.6
17.0
15.7
3.5
3.1
20.6
19.8
2.4
2.2
Navkar Corporation
Buy
199
265
2,838
408
612
42.9
42.3
6.8
11.5
29.4
17.3
2.0
1.8
6.9
10.5
7.7
5.2
UFO Moviez
Neutral
471
-
1,301
619
685
33.2
33.4
30.0
34.9
15.7
13.5
2.2
1.9
13.8
13.9
1.6
1.3
VRL Logistics
Neutral
293
-
2,676
1,902
2,119
16.7
16.6
14.6
16.8
20.1
17.4
4.4
3.9
21.9
22.2
1.5
1.3
Team Lease Serv.
Neutral
1,110
-
1,898
3,229
4,001
1.5
1.8
22.8
32.8
48.8
33.8
5.2
4.5
10.7
13.4
0.5
0.4
S H Kelkar & Co.
Neutral
308
-
4,455
1,036
1,160
15.1
15.0
6.1
7.2
50.5
42.9
5.4
4.9
10.7
11.5
4.1
3.6
Quick Heal
Neutral
225
-
1,578
408
495
27.3
27.0
7.7
8.8
29.1
25.6
2.7
2.7
9.3
10.6
3.0
2.5
Narayana Hrudaya
Neutral
319
-
6,519
1,873
2,166
11.5
11.7
2.6
4.0
120.6
80.5
7.4
6.7
6.1
8.3
3.5
3.0
Manpasand Bever.
Neutral
709
-
3,549
836
1,087
19.6
19.4
16.9
23.8
42.0
29.8
5.0
4.4
12.0
14.8
4.0
3.0
Parag Milk Foods
Neutral
330
-
2,772
1,919
2,231
9.3
9.6
9.5
12.9
34.9
25.5
5.4
4.5
15.5
17.5
1.6
1.4
Mirza International
Buy
90
113
1,077
1,024
1,148
18.0
18.0
6.9
8.0
13.0
11.2
2.2
1.9
16.6
16.2
1.2
1.1
Source: Company, Angel Research; Note: *December year end; #September year end; &October year end; Price as on September 19, 2016
Market Outlook
September 20, 2016
Research Team Tel: 022 - 39357800
DISCLAIMER
Angel Broking Private Limited (hereinafter referred to as “Angel”) is a registered Member of National Stock Exchange of India
Limited,Bombay Stock Exchange Limited and Metropolitan Stock Exchange Limited. It is also registered as a Depository Participant with
CDSL and Portfolio Manager with SEBI. It also has registration with AMFI as a Mutual Fund Distributor. Angel Broking Private Limited is a
registered entity with SEBI for Research Analyst in terms of SEBI (Research Analyst) Regulations, 2014 vide registration number
INH000000164. Angel or its associates has not been debarred/ suspended by SEBI or any other regulatory authority for accessing
/dealing in securities Market. Angel or its associates/analyst has not received any compensation / managed or
co-managed public offering of securities of the company covered by Analyst during the past twelve months.
This document is solely for the personal information of the recipient, and must not be singularly used as the basis of any investment
decision. Nothing in this document should be construed as investment or financial advice. Each recipient of this document should make
such investigations as they deem necessary to arrive at an independent evaluation of an investment in the securities of the companies
referred to in this document (including the merits and risks involved), and should consult their own advisors to determine the merits and
risks of such an investment.
Reports based on technical and derivative analysis center on studying charts of a stock's price movement, outstanding positions and
trading volume, as opposed to focusing on a company's fundamentals and, as such, may not match with a report on a company's
fundamentals. Investors are advised to refer the Fundamental and Technical Research Reports available on our website to evaluate the
contrary view, if any.
The information in this document has been printed on the basis of publicly available information, internal data and other reliable
sources believed to be true, but we do not represent that it is accurate or complete and it should not be relied on as such, as this
document is for general guidance only. Angel Broking Pvt. Limited or any of its affiliates/ group companies shall not be in any way
responsible for any loss or damage that may arise to any person from any inadvertent error in the information contained in this report.
Angel Broking Pvt. Limited has not independently verified all the information contained within this document. Accordingly, we cannot
testify, nor make any representation or warranty, express or implied, to the accuracy, contents or data contained within this document.
While Angel Broking Pvt. Limited endeavors to update on a reasonable basis the information discussed in this material, there may be
regulatory, compliance, or other reasons that prevent us from doing so.
This document is being supplied to you solely for your information, and its contents, information or data may not be reproduced,
redistributed or passed on, directly or indirectly.
Neither Angel Broking Pvt. Limited, nor its directors, employees or affiliates shall be liable for any loss or damage that may arise from
or in connection with the use of this information.